財務ハイライト
財務ハイライト(経営成績と経営数値目標)
経営成績と経営数値目標(上段:実績、下段:計画・目標)
| 年 | 2020 | 2021 | 2022 | 2023 | 2024 | 2025 | |||
|---|---|---|---|---|---|---|---|---|---|
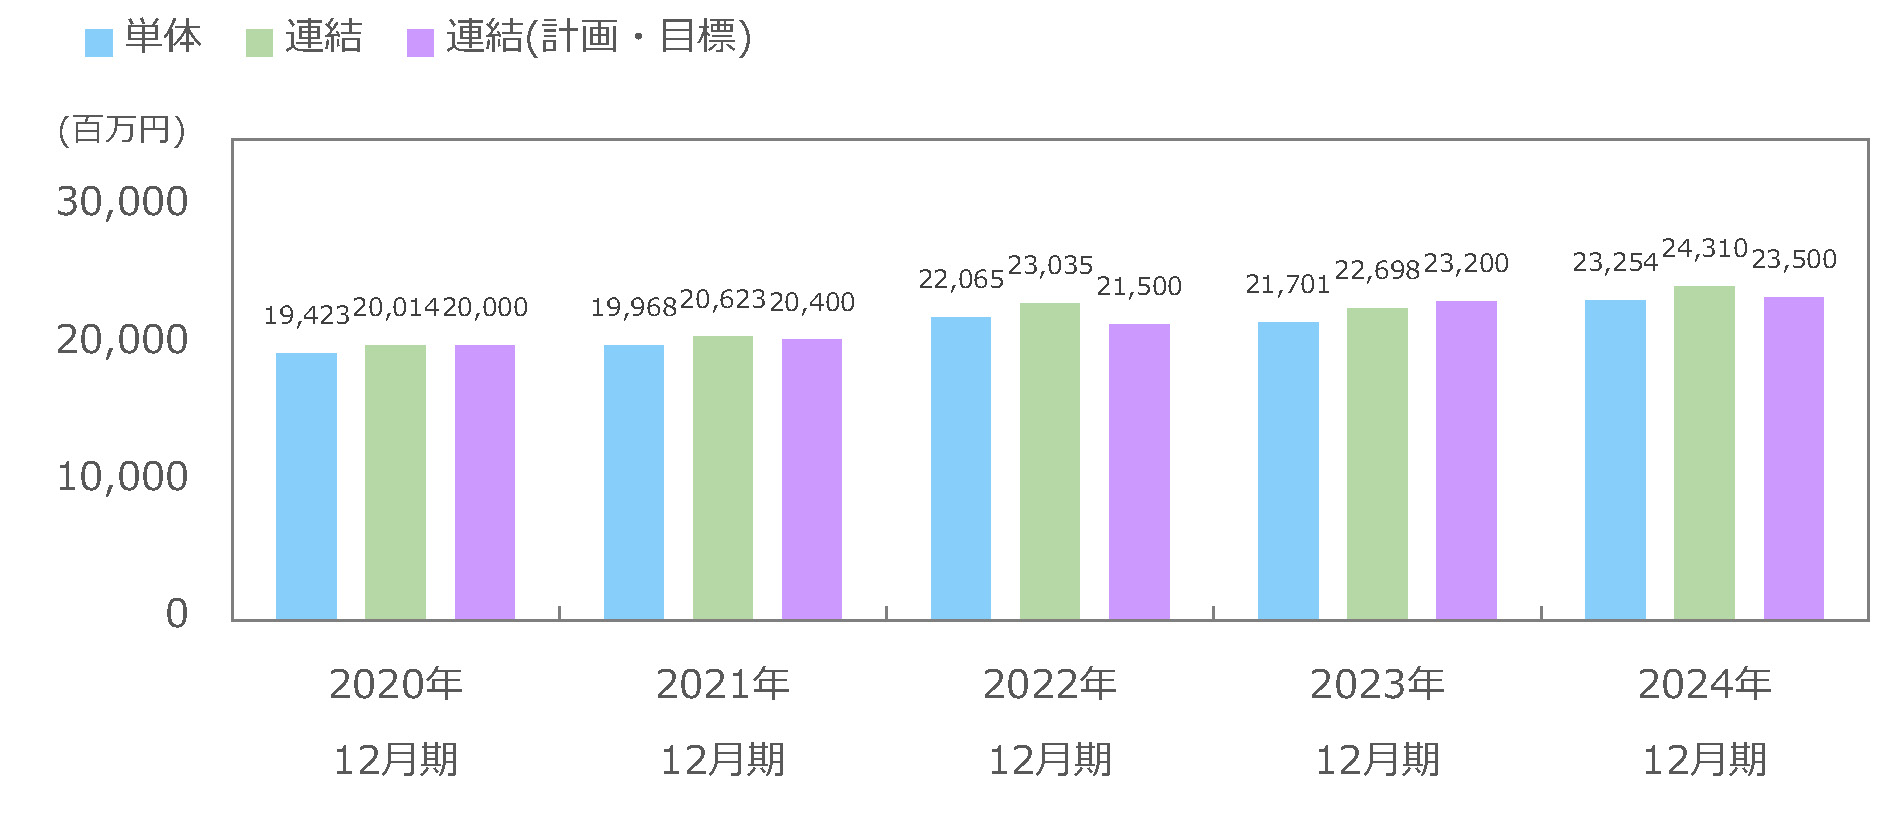
| 連結売上高(百万円) | 20,014 (20,000) |
20,623 (20,400) |
23,035 (21,500) |
22,698 (23,200) |
24,310 (23,500) |
- (25,000) |
|||
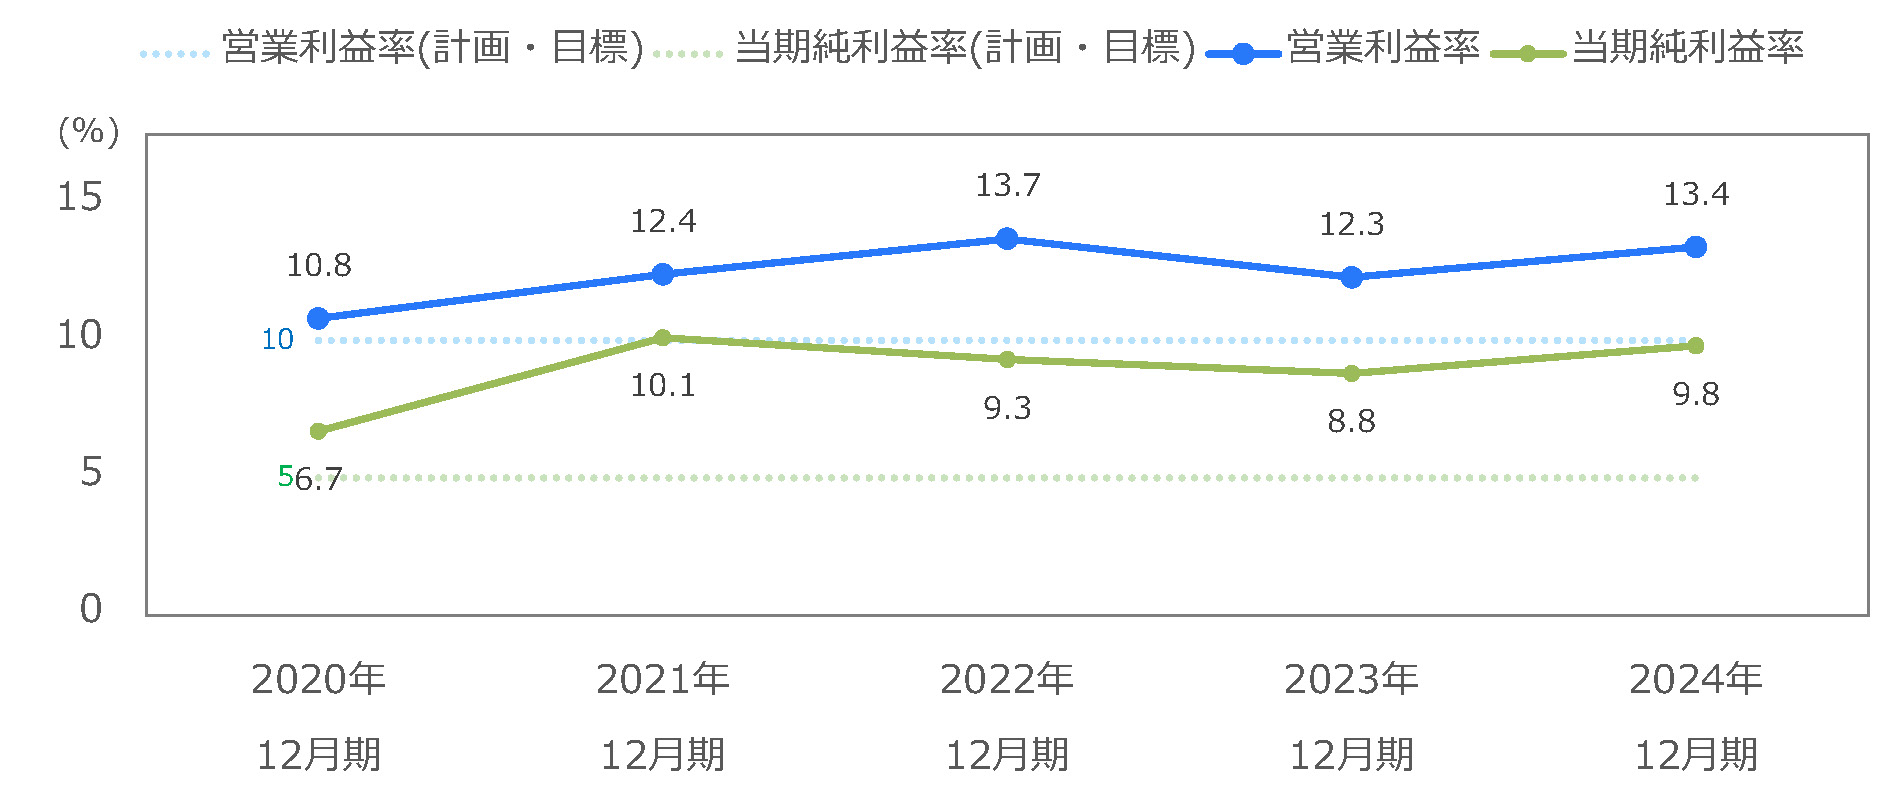
| 売上高営業利益率(%) | 10.8 (10.0) |
12.4 (10.0) |
13.7 (10.0) |
12.3 (10.0) |
13.4 (10.0) |
- (12.0) |
|||
| 売上高当期純利益率(%) | 6.7 (5.0) |
10.1 (5.0) |
9.3 (5.0) |
8.8 (5.0) |
9.8 (5.0) |
- (-) |
|||
| 詳細は、決算短信 等をご参照ください。 | |||||||||
売上高の推移
注)記載金額は、表示単位未満を切り捨てて表示しています。
売上高営業利益率・売上高当期純利益率の推移(連結)
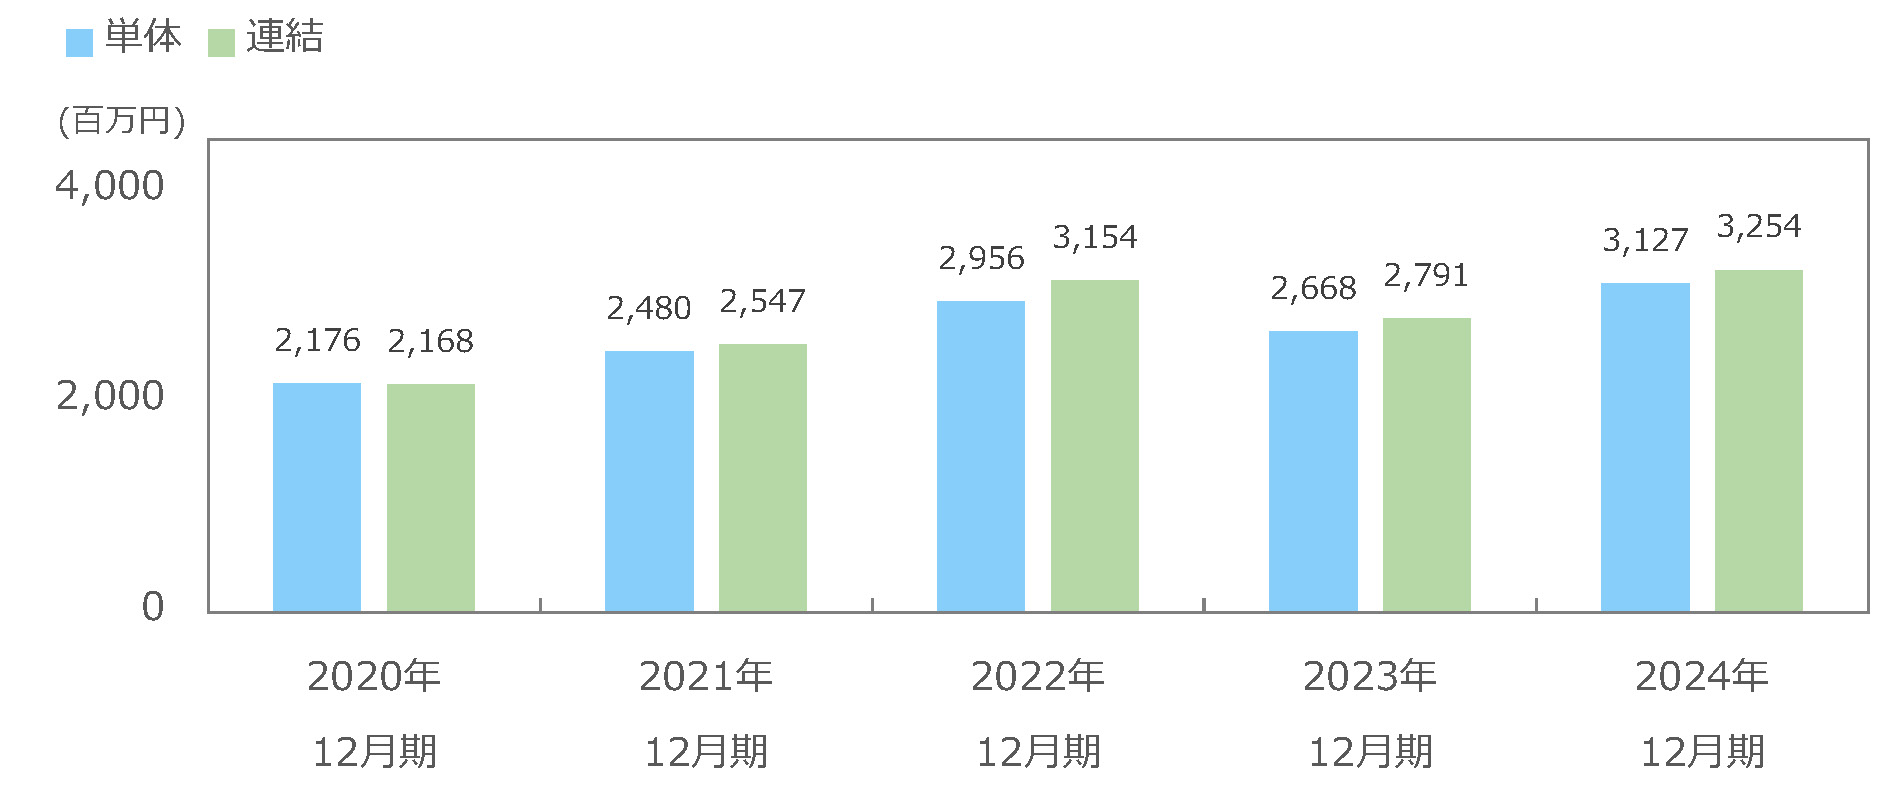
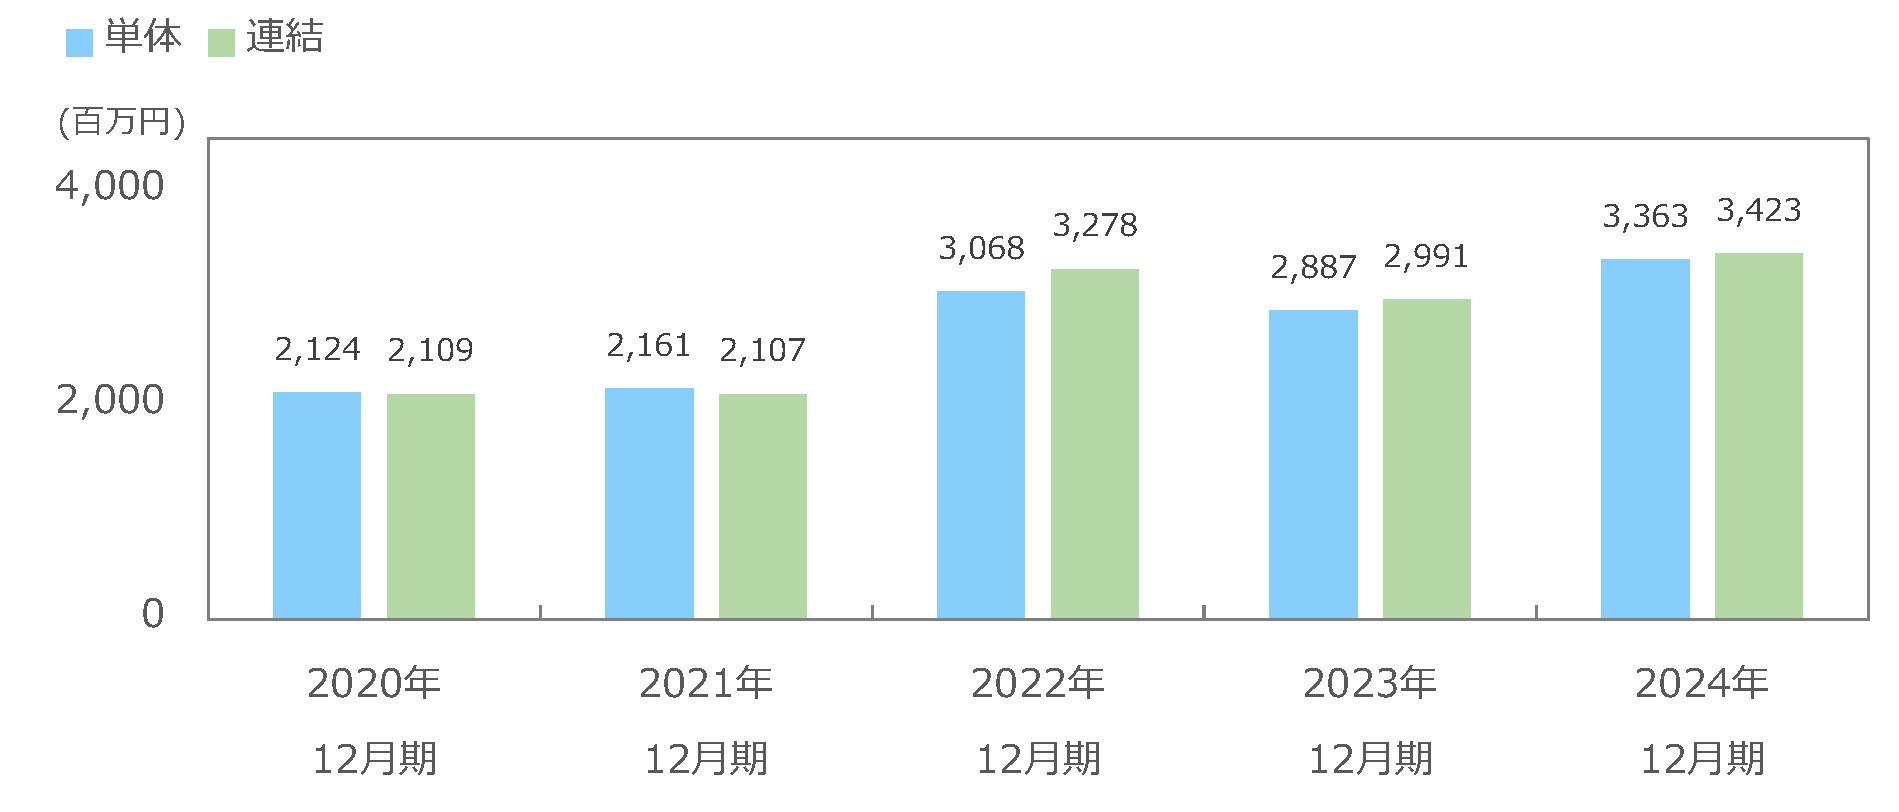
営業利益の推移
経常利益の推移
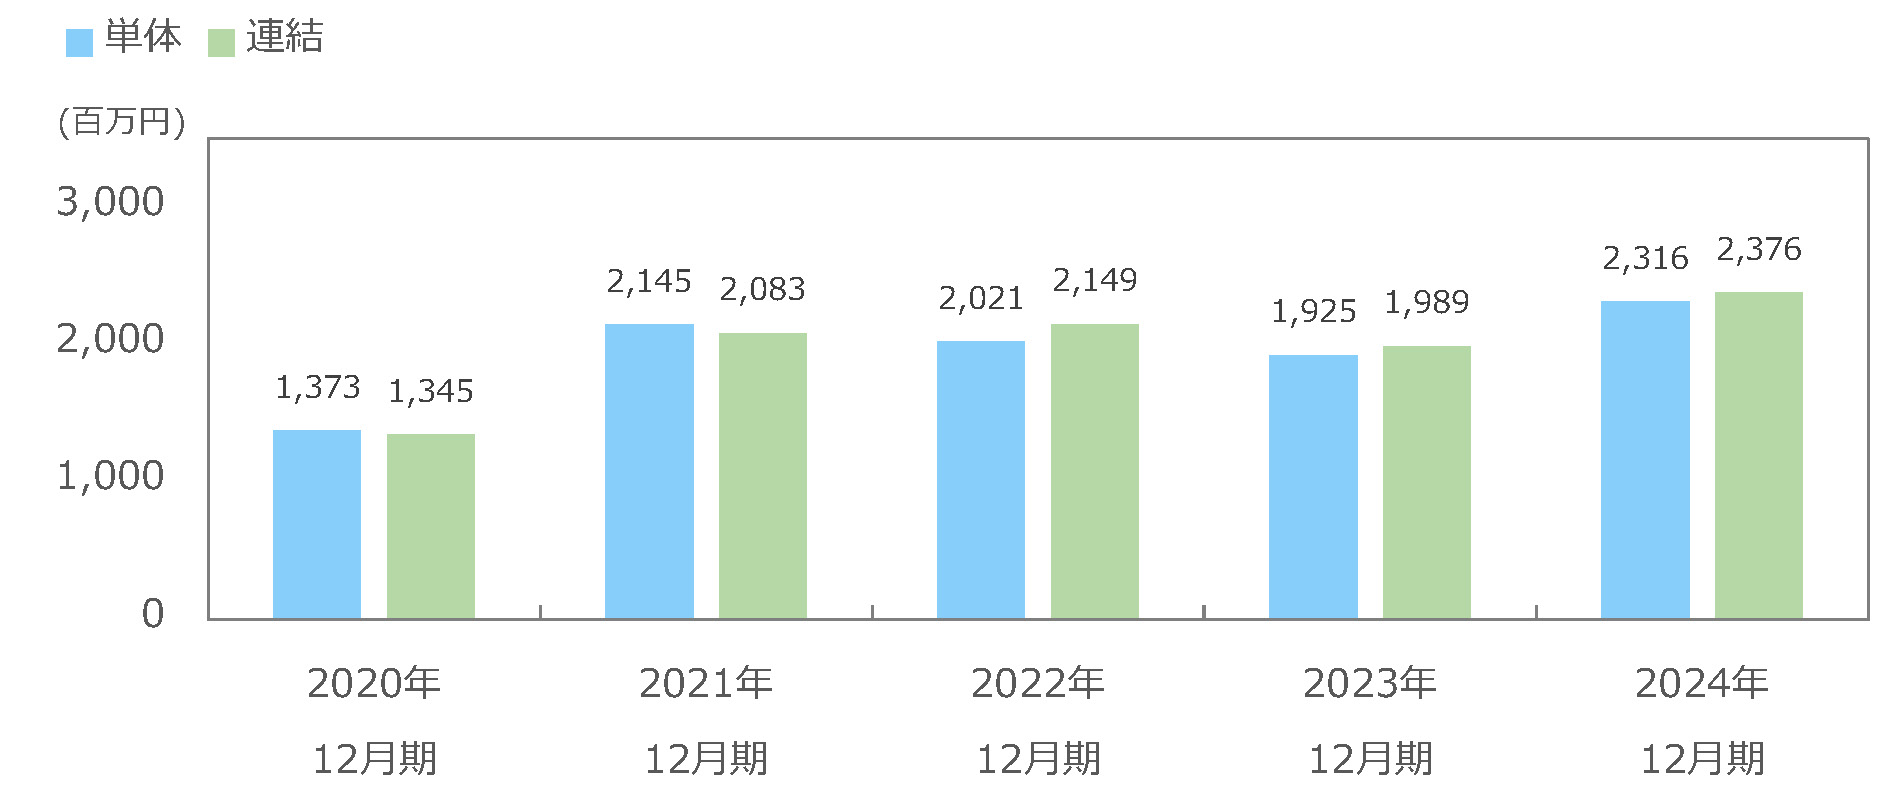
親会社株主に帰属する当期純利益の推移
1株当たり当期純利益の推移
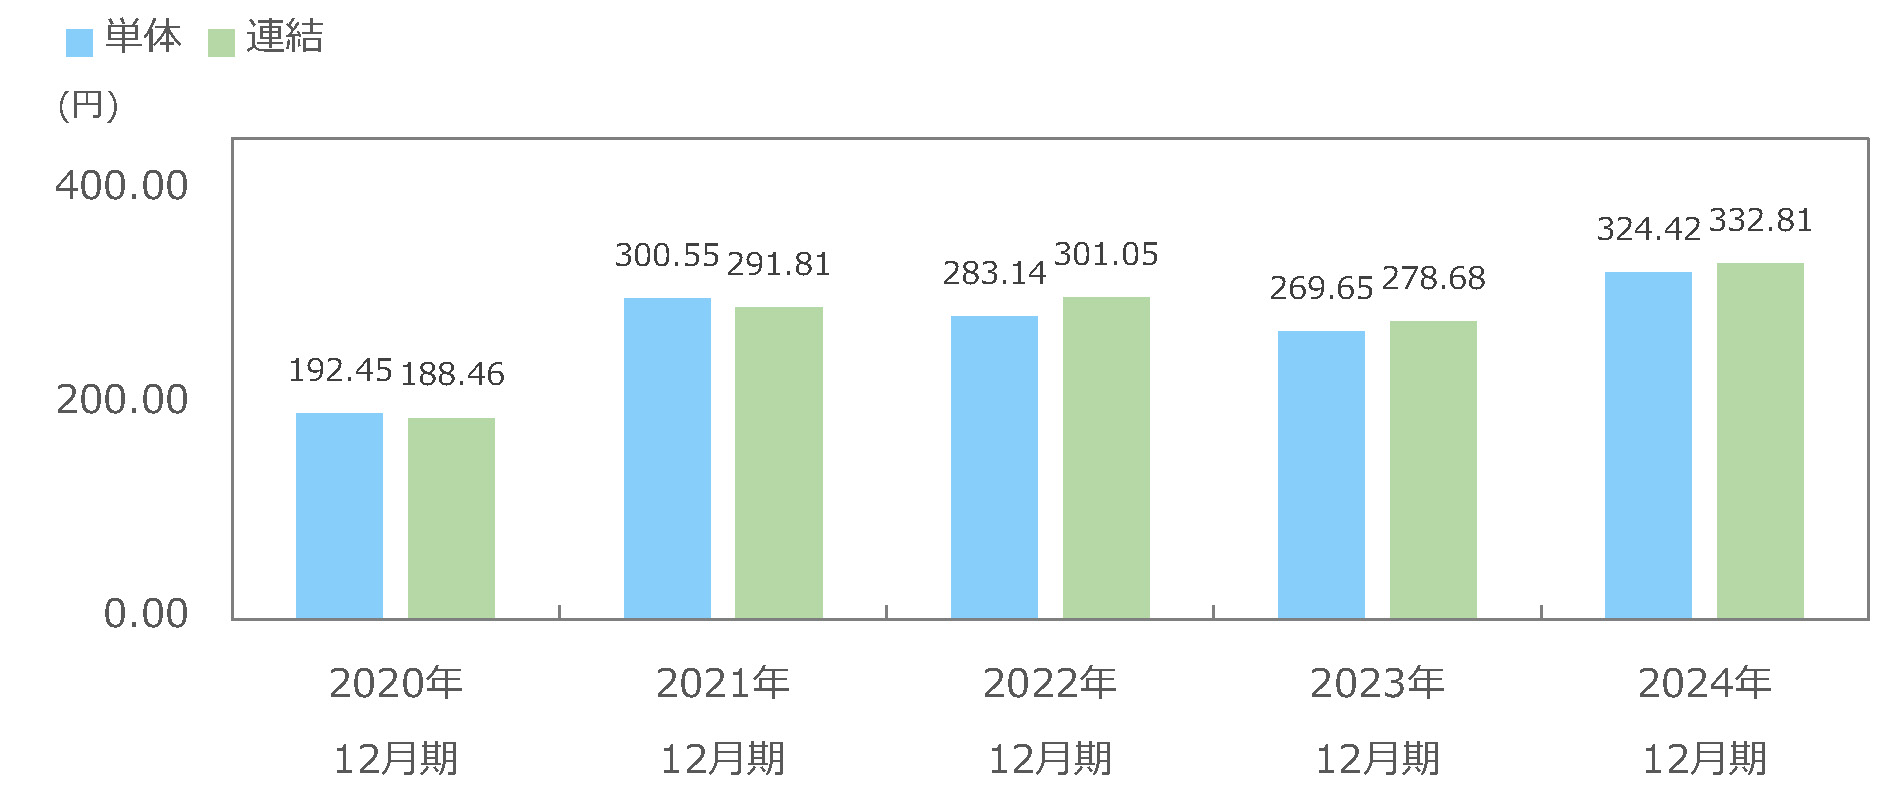
注)1株当たり当期純利益は、期中平均株式数に基づき算出しています。
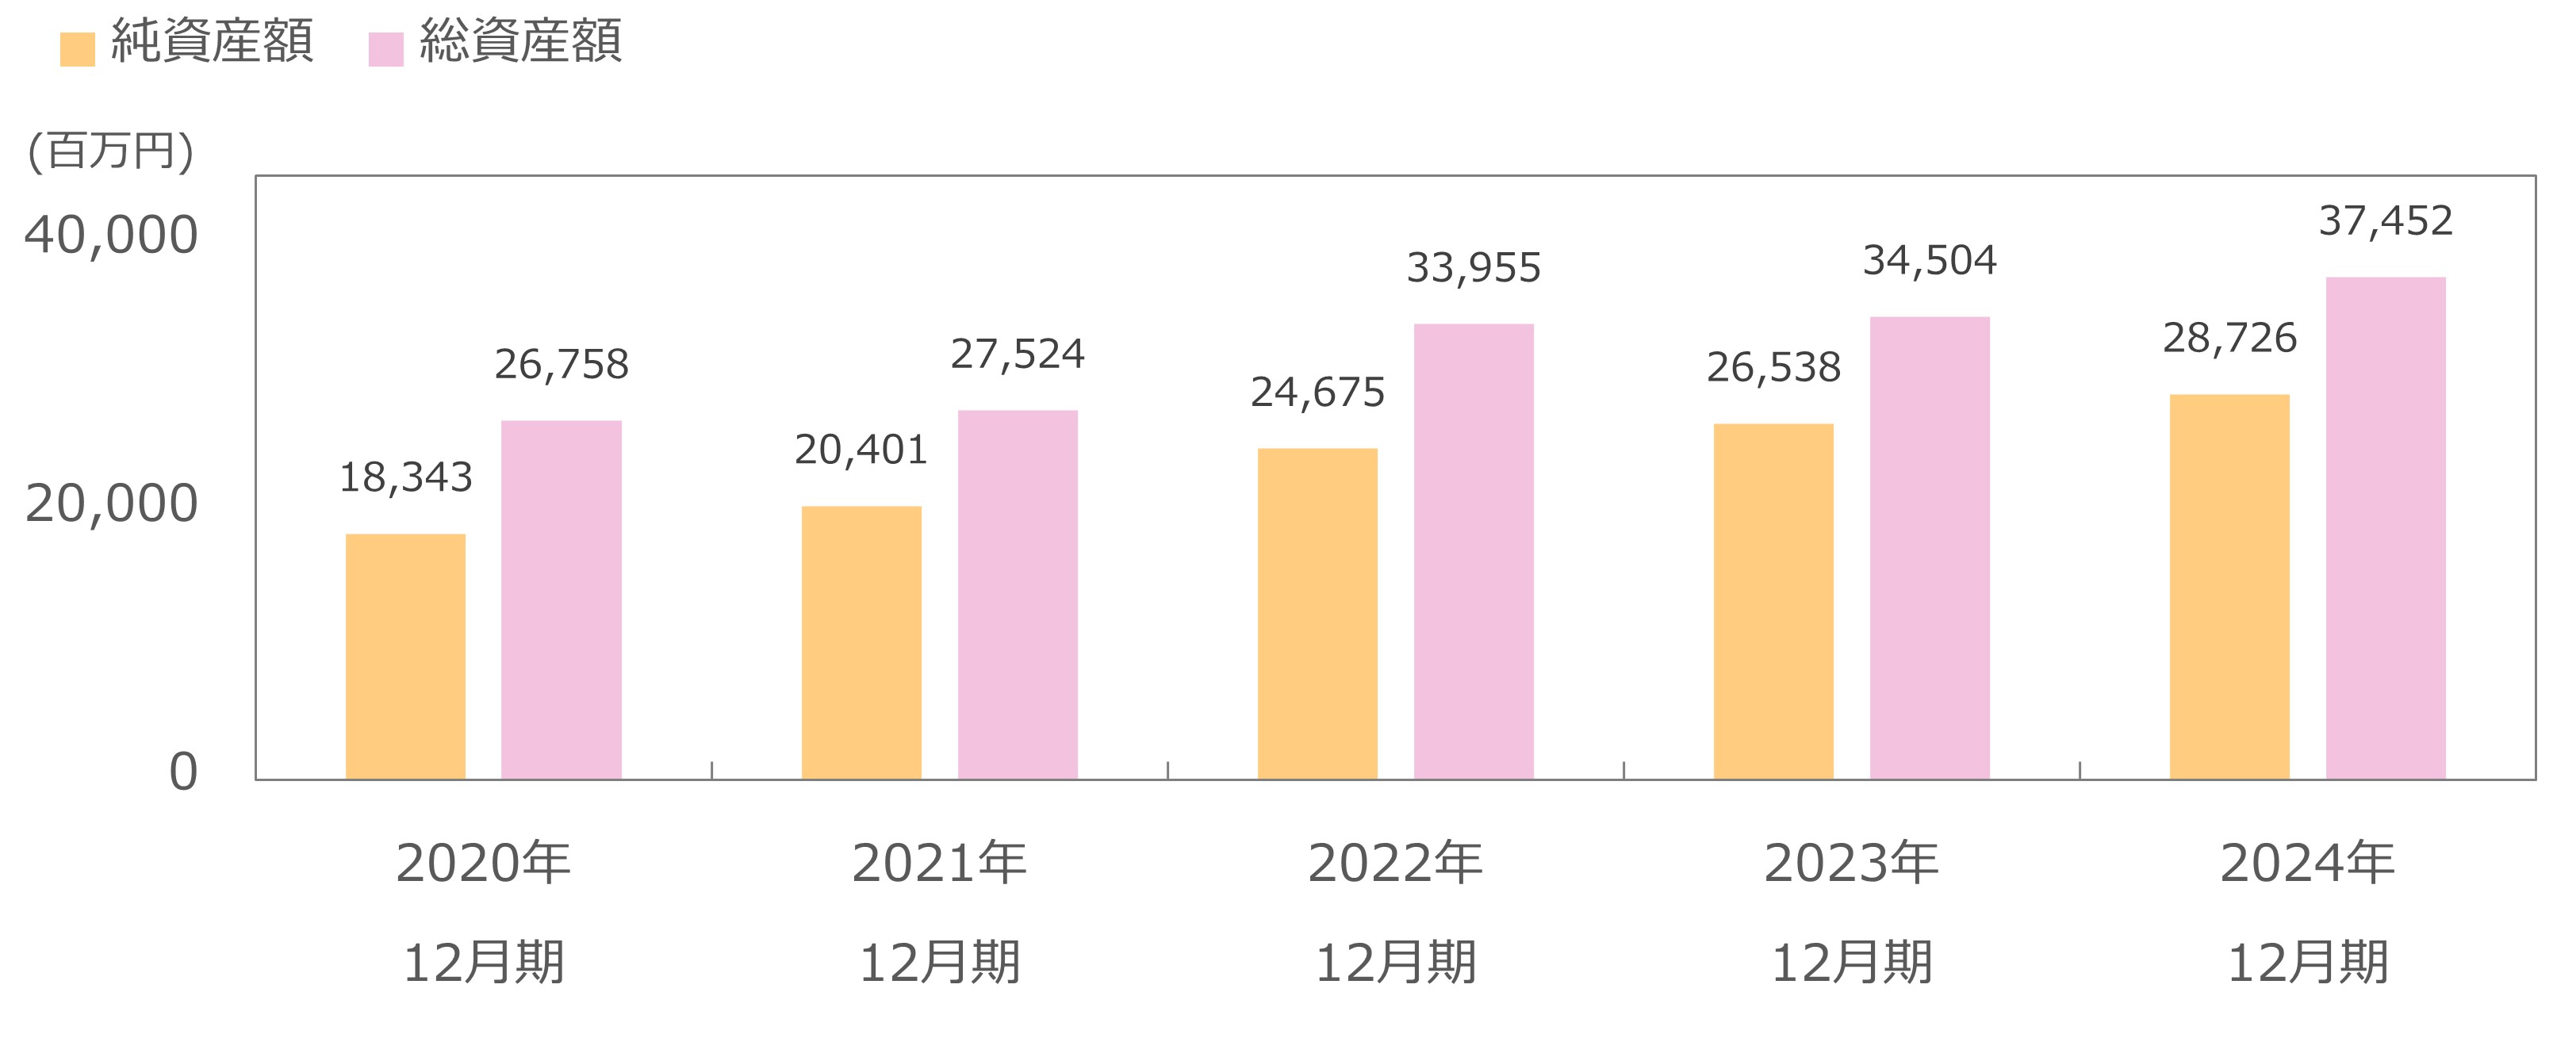
純資産・総資産の推移(連結)